Countculture
Pulse Analytics · Transport agencies

Active Transport Monitoring

Count every mode, at more sites, for the same budget

Loops, tubes and manual surveys count vehicles well and everyone else badly. A Count Pod gives you continuous, classified counts of pedestrians, cyclists, e-scooters and vehicles, with direction and speed, from one device. It installs in under two hours and needs no grid power, no civil works and none of the approvals that come with them.
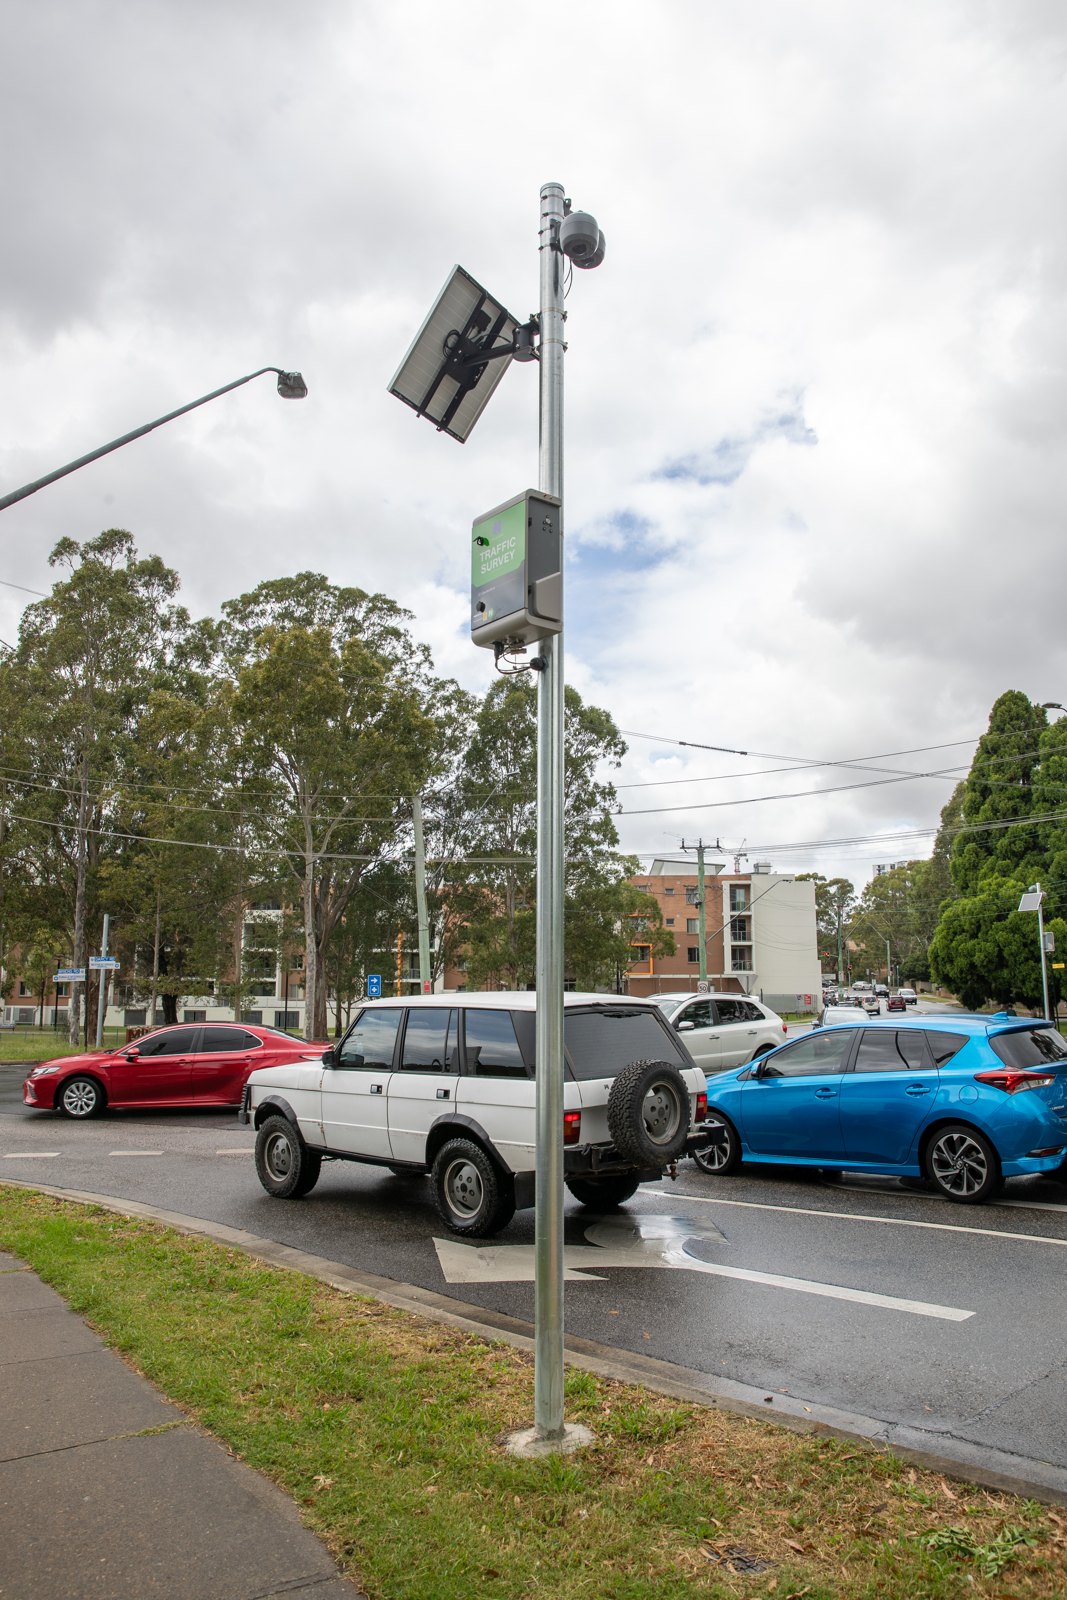
Solar-powered Count Pod mounted on a roadside pole above a busy road
Built for

Transport planners, active mode teams and road controlling authorities

You have good data on vehicles and very little on anyone else. Business cases for walking and cycling investment rely on periodic surveys, mode-shift targets get reported without a baseline, and each new count site brings a power connection, a traffic management plan and months of approvals with it. Coverage of the network is limited by process as much as by budget.
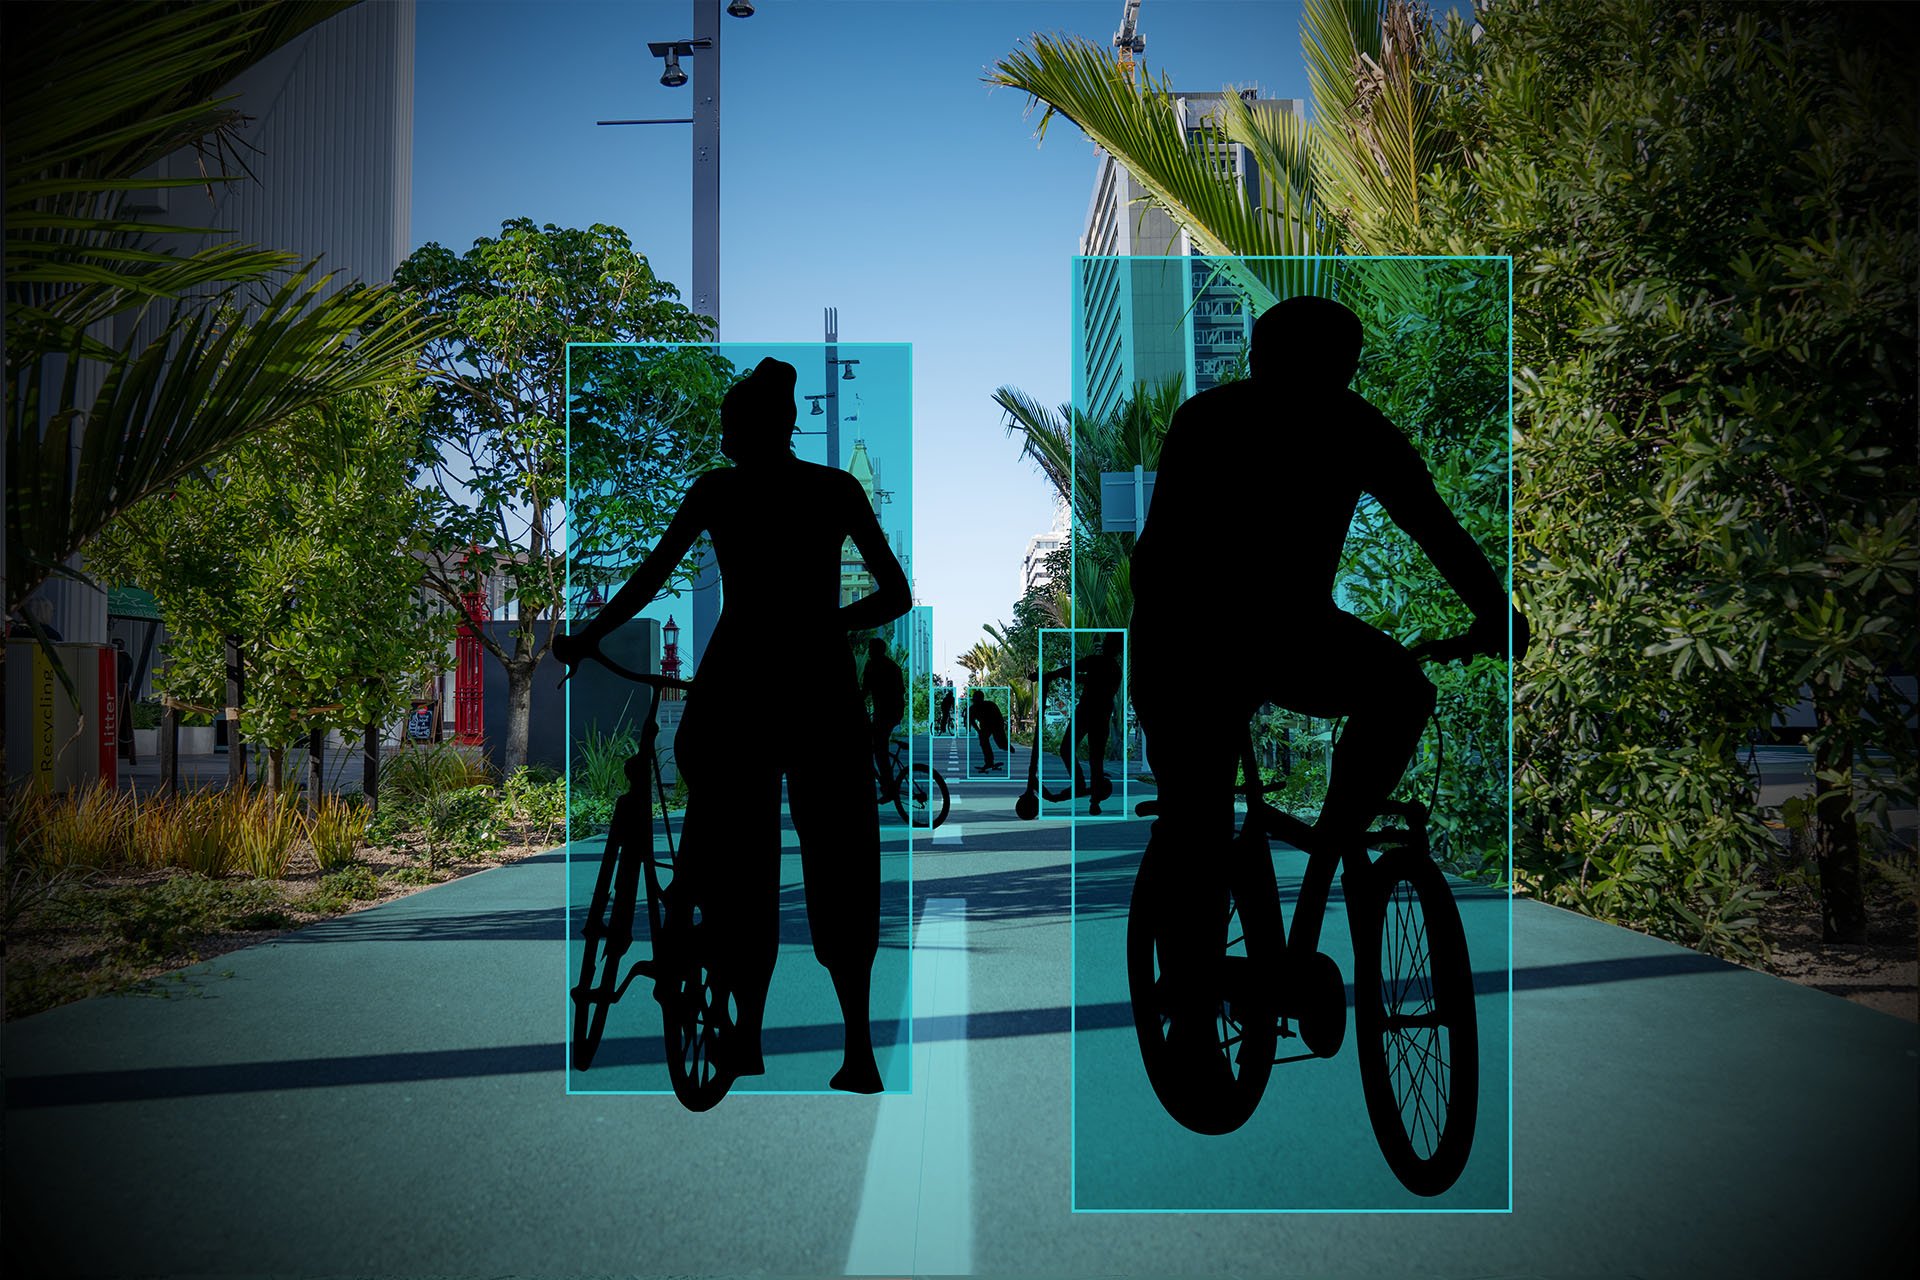
Silhouettes of cyclists and scooter riders on a shared path at dusk
Watch · video
Countculture, empowering sustainable transport
Solar Count Pods on shared paths and cycleways
Close the data gap across all modes
Pedestrians, cyclists, e-scooters and vehicles from the same sensor, classified, with direction and speed. Mode share and mode shift become measurements you can report.
Cover more of the network for the same budget
Solar Count Pods need no grid connection, trenching or civil works. A site costs a fraction of a conventional counter, and the only approval you need is for a bracket on a pole.
Match the power to the site
Solar where there is sun and no supply. A street-lighting connection where that network is already in place. Mains where the site needs a guaranteed 24/7 feed.
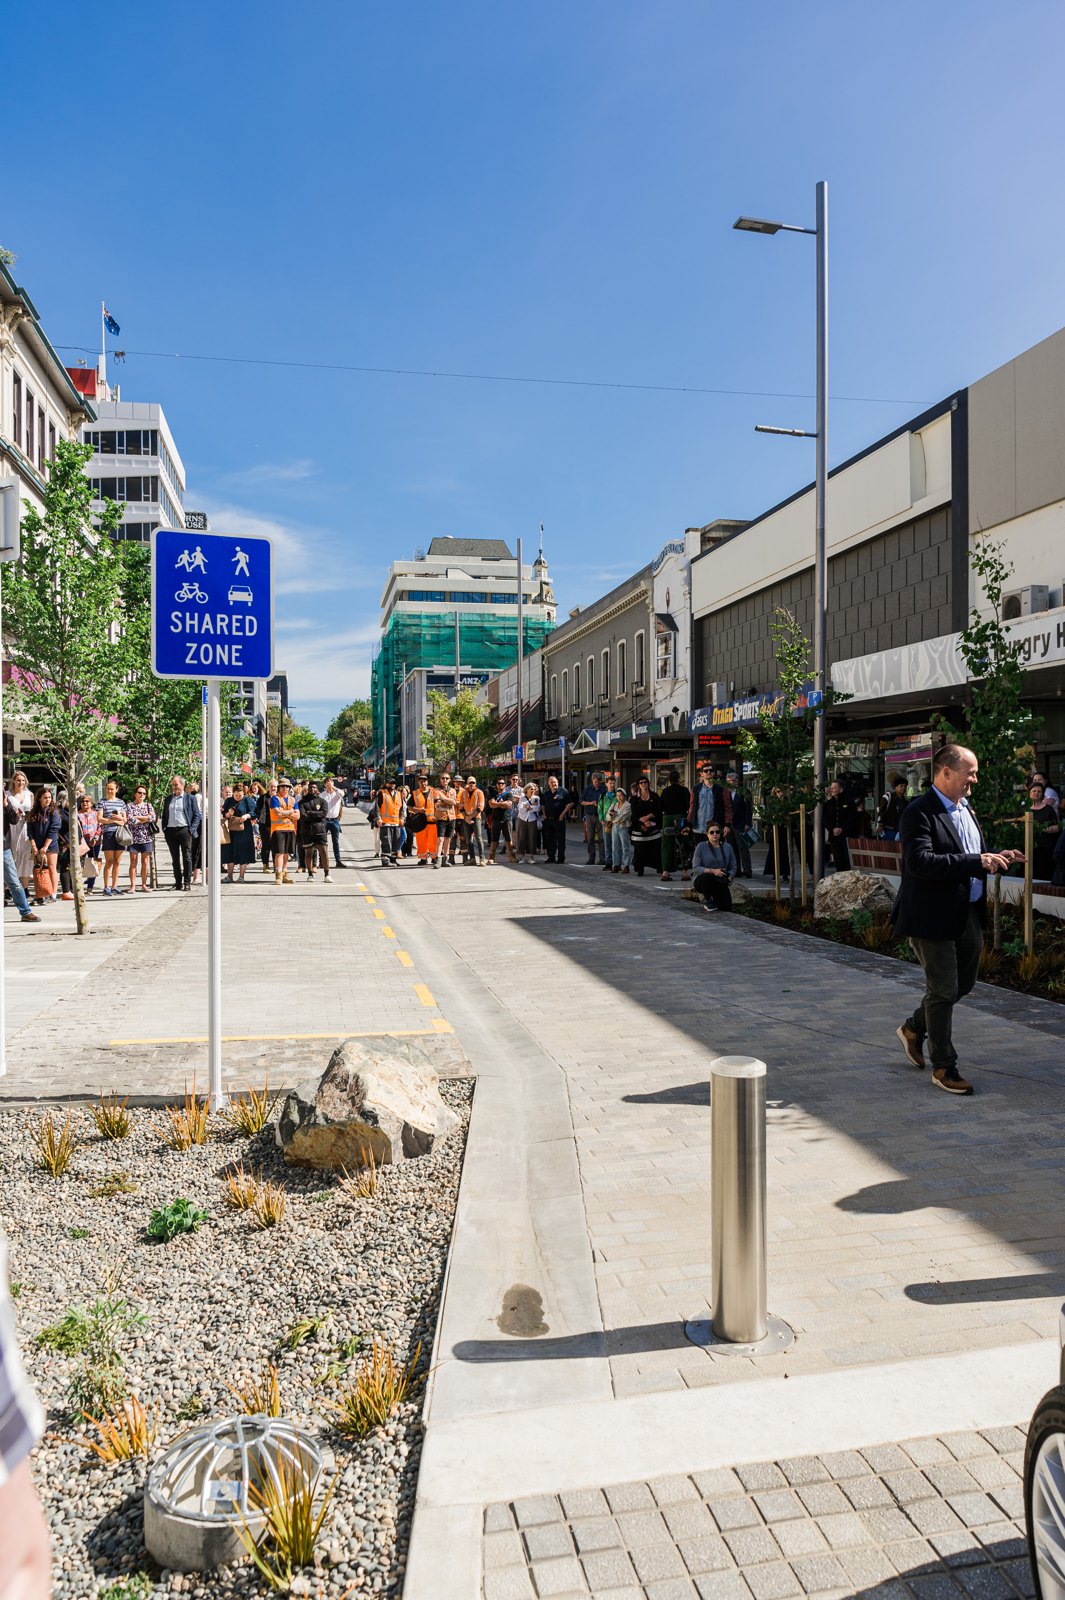
The new shared zone on George Street, Dunedin
What you get

What’s included

  • One pod covers a shared path, an on-road cycleway and the carriageway at once, each reported separately
  • Direction and speed for each mode, so a before-and-after comparison on the same corridor compares like with like
  • Weather-adjusted trends and CO₂ savings from walking and cycling
  • Mobility dashboards with weather, events and other overlays alongside every count, to understand mode shift and how your infrastructure is performing
How it works

How a deployment runs

01
Network design

We map your sites, choose Count Pods or CCTV integration per location, and fit each pod with a lens for its mounting height.

02
Install

Solar Count Pods need no mains power or trenching. CCTV integration runs on a lightweight CPU server inside your network.

03
Validate

Our engineering team loads a custom AI model for each site, then calibrates, tunes and ground-truths it against manual counts before go-live. All of it is done remotely.

04
Decide

Pulse Analytics dashboards, automated reports and the REST API put the data where your team already works.
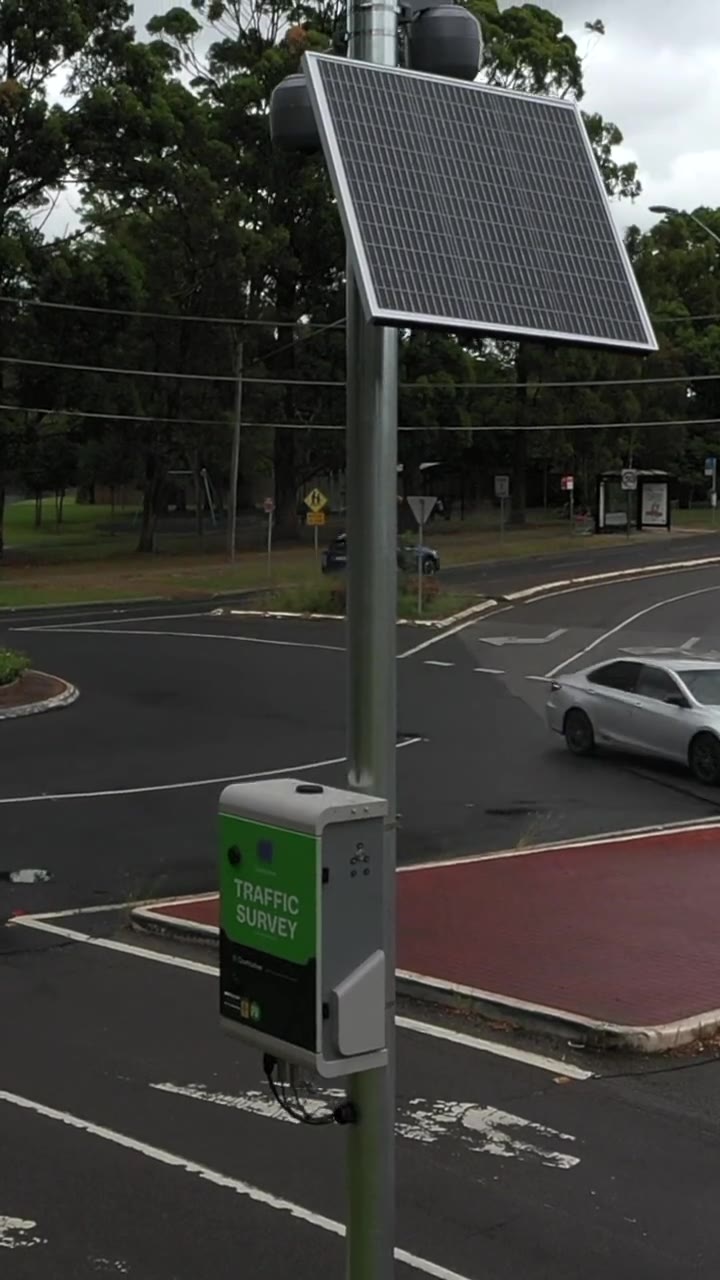
Count Pods in the field
In the field

More count sites, fewer approvals

Count Pods on existing poles at intersections, parks and shared paths. After commissioning, calibration, model updates and monitoring all happen remotely.

City Pulse

Corridor counts, next to everything else happening in the city

Transport data on its own tells you what happened on a corridor. City Pulse puts it beside the other things that move a city: events, cruise calls, weather, construction and the state of the road network.

  • Transport: corridor congestion and delay, and how people arrive in the centre
  • Construction alerts: roadworks and disruption on the map, seen alongside movement
  • Project impact: a before-and-after baseline for a major city change, set before the diggers arrive
  • Sensor map and precinct performance: every count site as one network, compared fairly per sensor hour
See City Pulse
Outcomes

Customer results

↗
City of Sydney
City of Sydney

Oxford Street: counting footpath users as a cycleway opens

Sensors under shop awnings on business power supplies, classifying pedestrians, share bikes and cargo bikes on a busy retail street through a separated cycleway trial.
↗
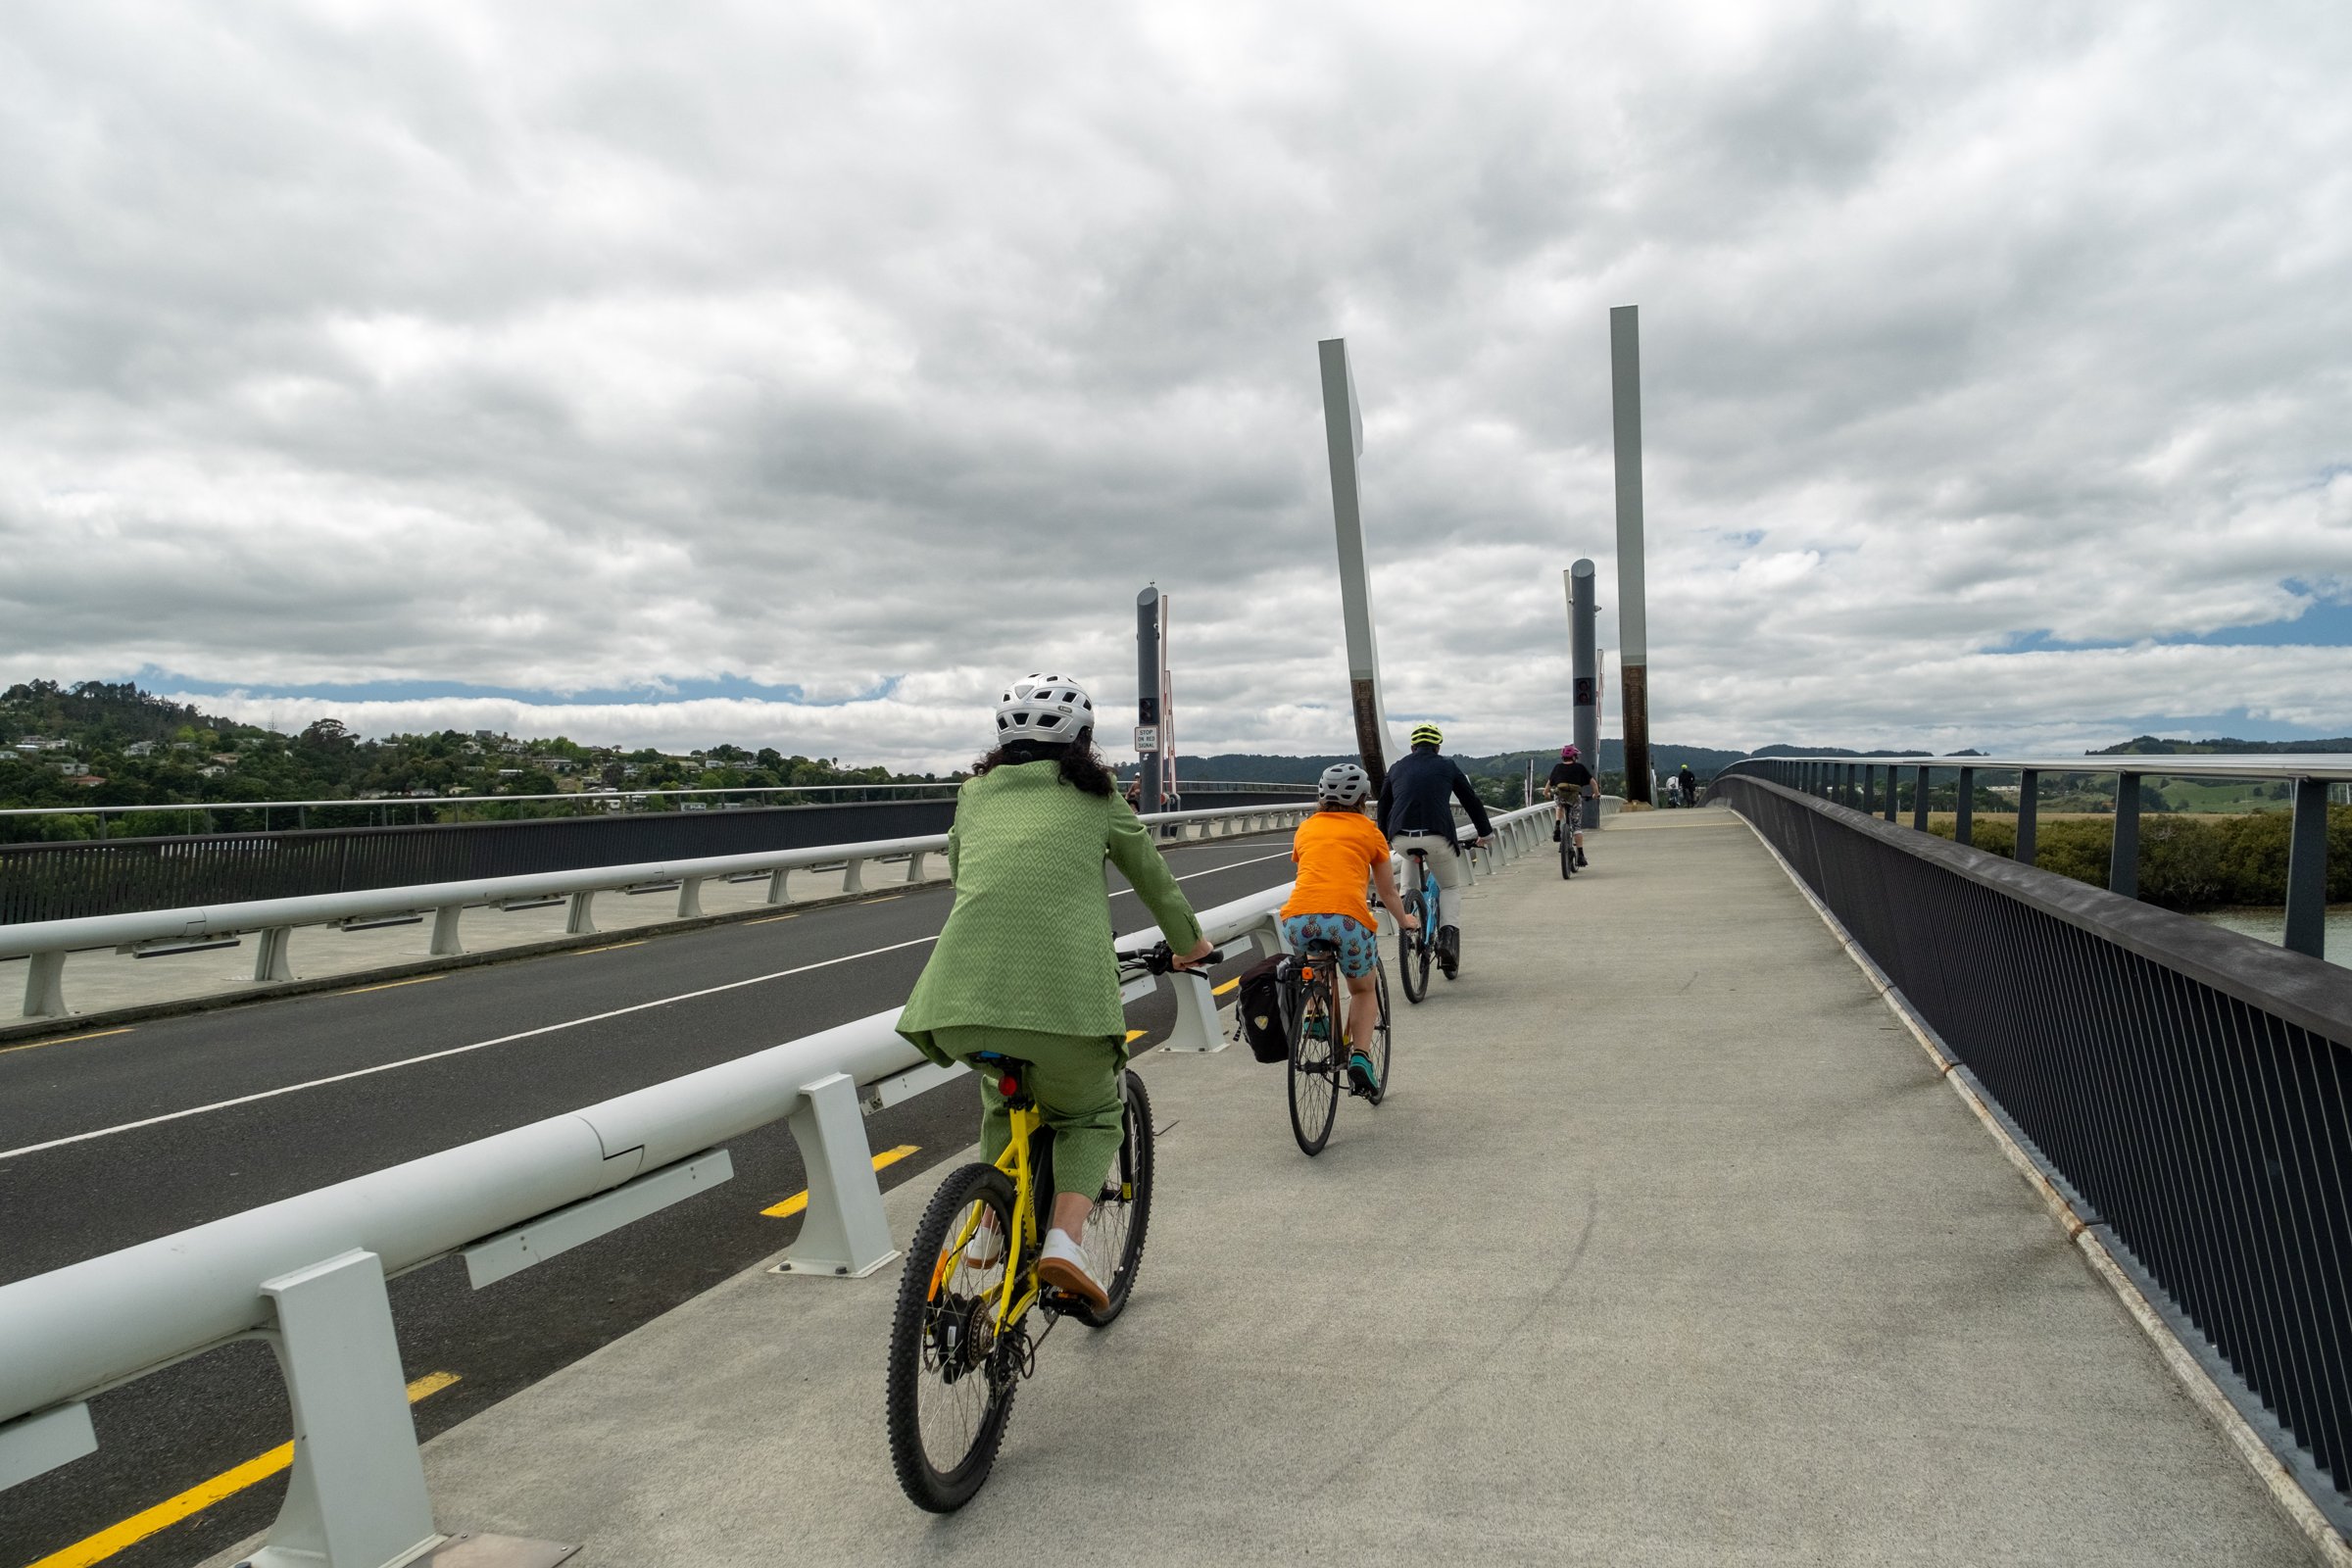
Cyclists on a Whangārei shared path
Whangārei District Council

Whangārei shared paths: cycling up 25 to 30% year on year

Cycling movements are running 25 to 30% above the same month a year earlier. “Monitoring these trends in real time has proven to be a game-changer.” Whangārei District Council

↗
Dunedin City Council

George Street: counting through three years of roadworks

14 sensors kept counting through a NZ$100m streetscape upgrade, with no retraining as the scene changed weekly.

Christchurch City Council logo
NZ Transport Agency logo
Napier City Council logo
City of Parramatta logo
City of Darwin logo
Whangārei District Council logo

See Pulse Analytics on your own sites.

Book a demo